R To trade or not to trade with Shitcoins and Memecoins (part 1)

Figure 1: Trade or not to Trade (Designed by Dooder / Freepik)
It took me long time to muster the motivation to write this post. I greedily dreamed of putting something together that would unveil the secret to crypto trading while amassing a fortune thank to my R skills. The title of the article would then be “How to get rich using R and how to get even richer talking about it” or the likes of that.
Well, it turned out to be a very different article.
In this series I will share what I had in mind and why it didn’t work. Perhaps, someone can shed some light on how to conduct a better analysis or more suitable tools for this purpose.
Sure, none of this is really new, but I will try to share as much detail as possible.
Trading what?
Shitcoins/Memecoins. These crypto-coins or tokens are highly volatile, risky, susceptible to market sentiment and manipulations. Their price is merely driven by hype and speculation and have no intrisic value whatsoever.
Strictly speaking, the terms do not mean exactly the same. But I use them interchangeably. In my opinion the difference is mostly subjective and, while working on this, I have become more and more skeptical about these coins so I have opted for calling them simply Shitcoins :|
Read the article Understanding Shitcoins and Memecoins for a clearer view on the differences.
Trading how?
Buy the Shitcoins before the prices go up and sell them before the prices go down. Voilà.
This strategy is called timing the market in the financial jargon. In this particular case the timing is event-based: some of the Shitcoins make it to well-known price-tracking websites where they are listed as “New Cryptocurrencies” and the working hypothesis goes as follows: the broader visibility to a large mass of greedy investors pumps up their prices as soon as they are listed only to fall shortly after. The Shitcoin price would then enter a new chapter where its evolution is no longer driven by the “listing” event but other factors.
Assumptions
The listing is the only event considered in this strategy and the expectation was that it would lead to profits even in a bearish market, as of the time of writing the many many … versions of this post. Simply put, the speculators and other bots cannot help doing their stuff, pumping up the price. So, even over a short period of time, the profits would make up for the eventual losses.
Rules and model
The trading strategy can be summarised in the following rules:
- Be fast. Buy as soon as the Shitcoins are listed to beat other speculators and bots.
- Don’t be greedy. Set a sell-limit: to execute a sale order as soon as the price rises above a desired price to take profit.
- Be brave..to a point. Set a stop-loss: to execute a sale order as soon as the price falls below a desired price to limit the loss.
- Do not linger. Set a time-limit: to execute a sale order regardless of the price after a certain period when the effect of the “listing” event has waned off. We are not informed traders, we do not really know what to do and we need to cash back whatever is left to buy new recently listed Shitcoins with the hope of having profits.
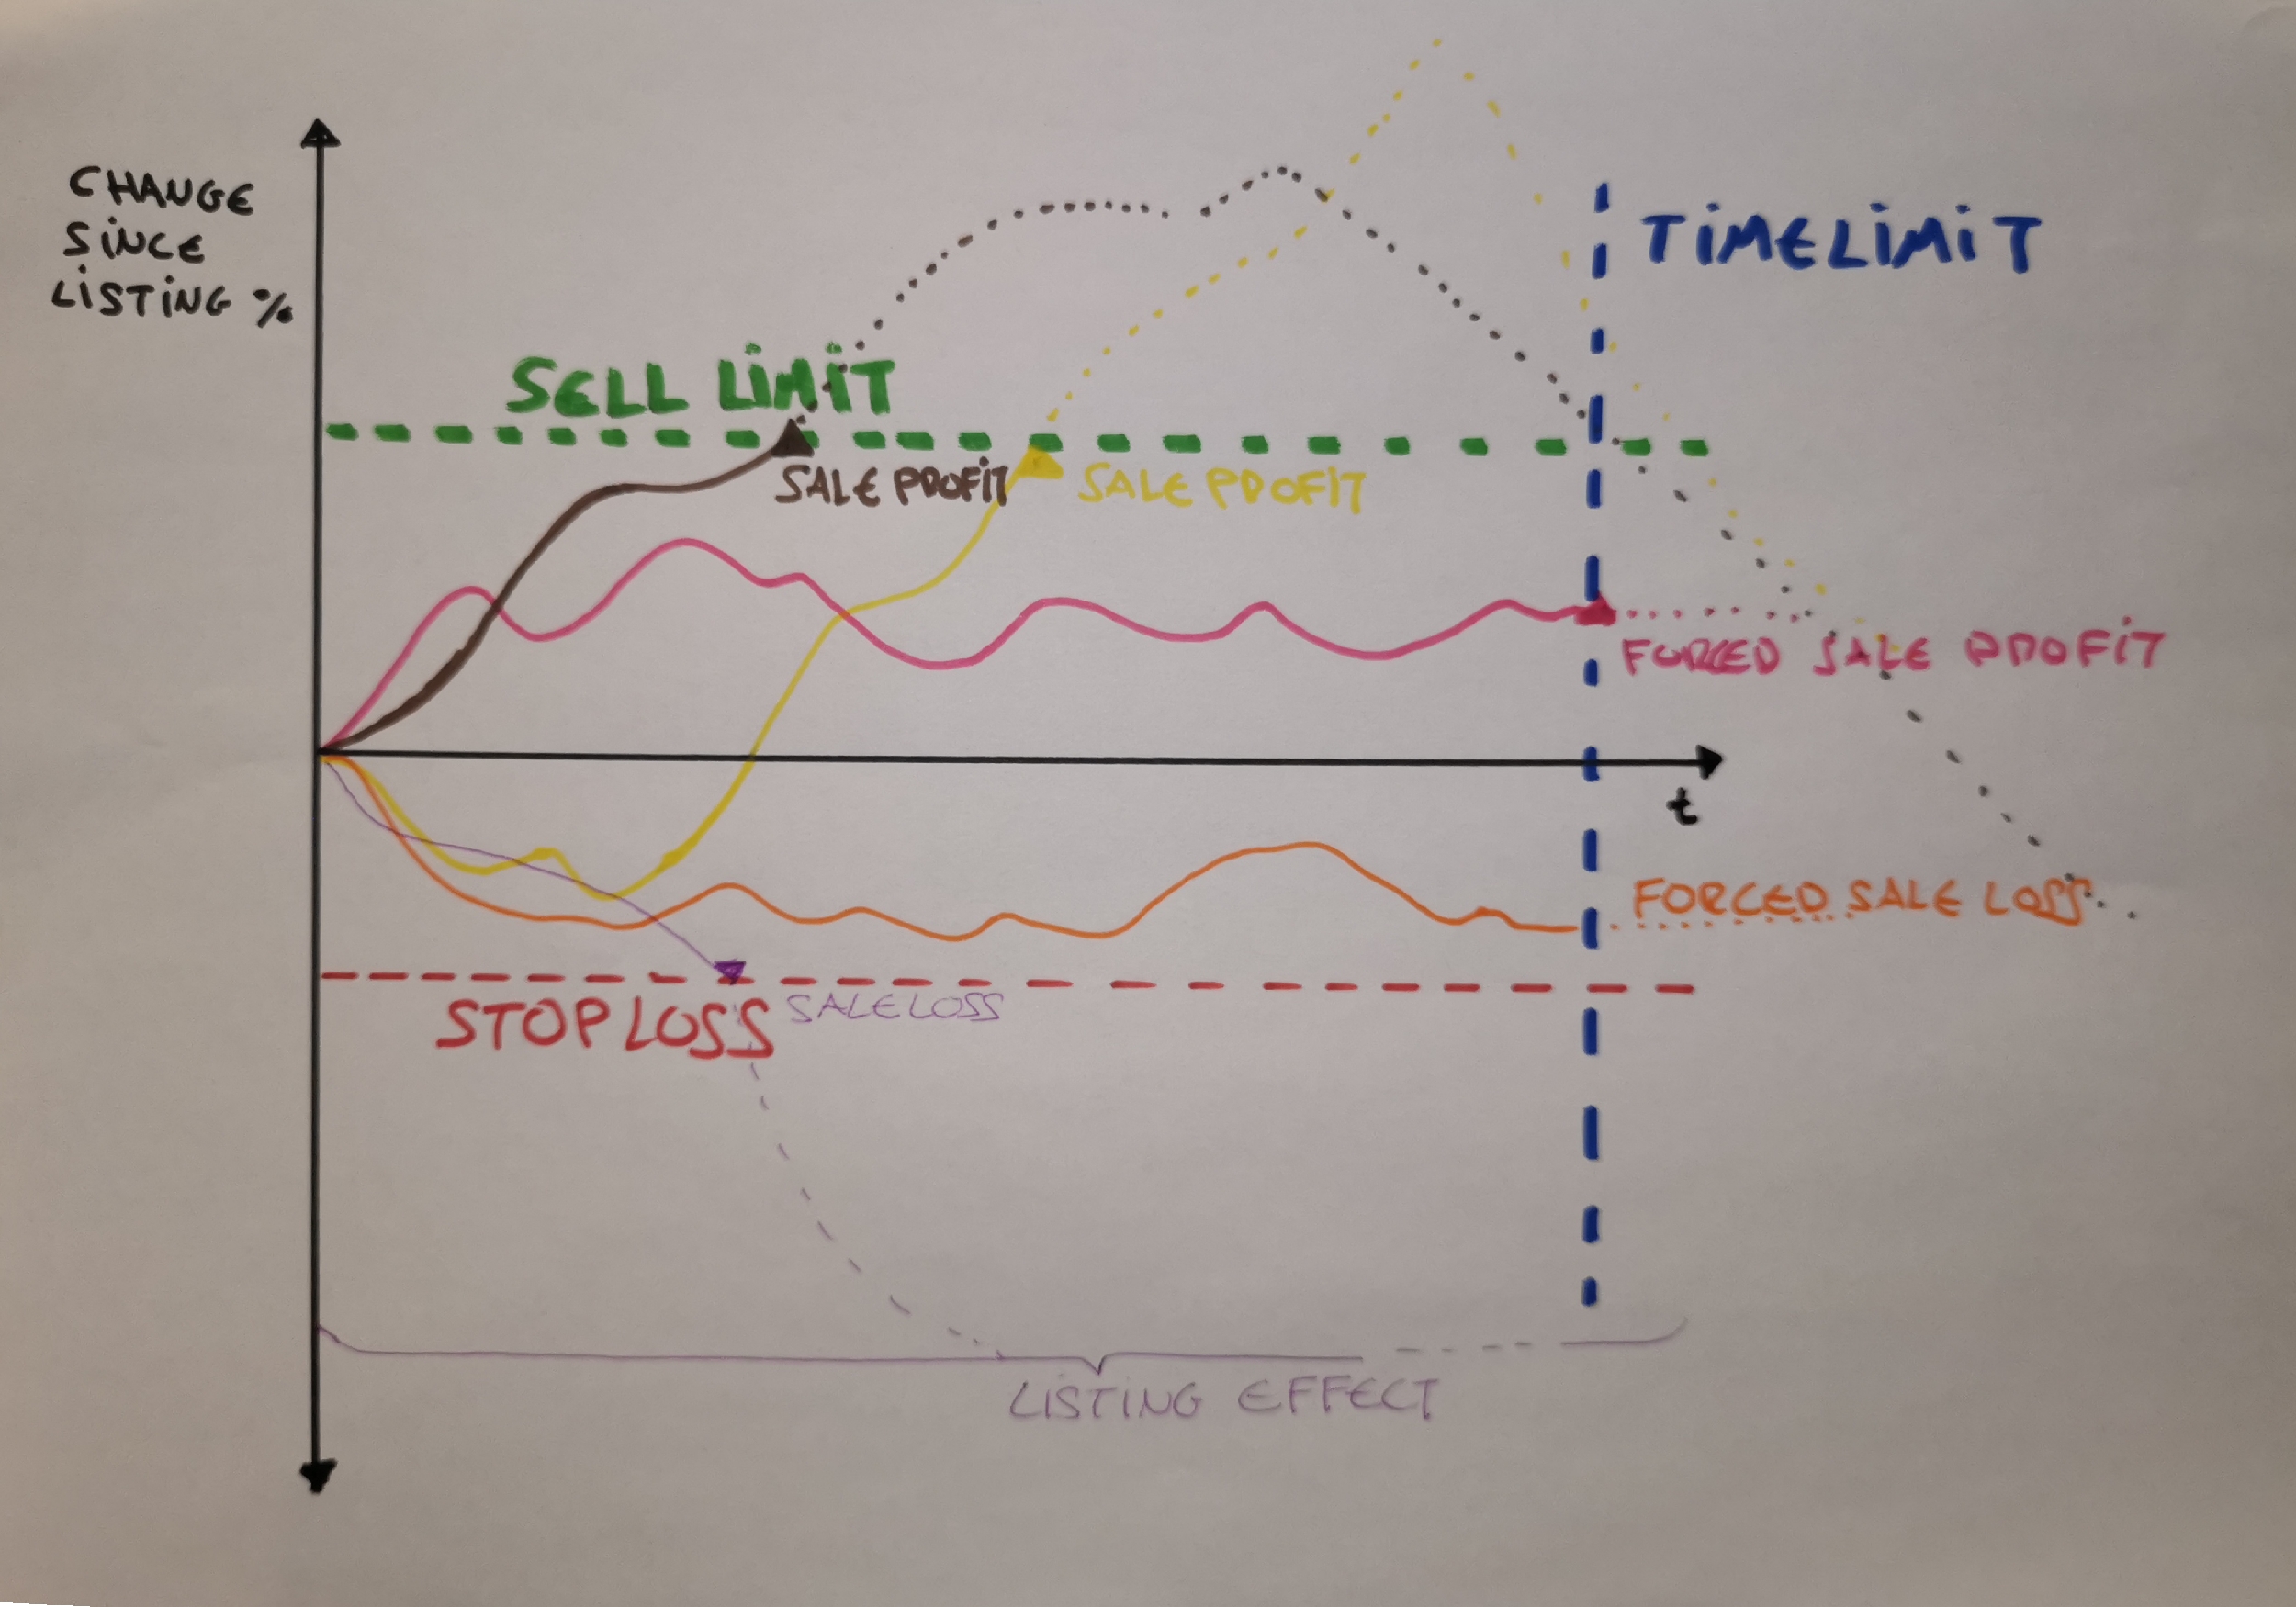
Figure 2: Assumptions and model
What happens after the purchase is framed by these parameters: sell-limit, stop-loss and time-limit; a purchase will always end up in a sale (if funds permit) due to one of them.
Thus, the possible outcomes of this strategy are as follows:
- SALE PROFIT: the price reaches the sell-limit, defined as a % increase since the purchase.
- SALE LOSS: the price reaches the stop-loss, defined as a % decrease since the purchase.
- FORCED SALE PROFIT: the time since the purchase exceeds the time-limit resulting in a sale in profit, the price increased but not reached the sell-limit.
- FORCED SALE LOSS: the time since the purchase exceeds the time-lmit resulting in a sale in loss, the price went down but not down enough to hit the stop-loss.
Which well-known price-tracking websites?
CoinMarketCap and CoinGecko were chosen due to the following reasons:
- although their free APIs do not provide the list of new cryptos or not with sufficient detail, their websites are easy to scrape. Update: This is no longer the case for CoingGecko since the 8th of May.
- they covered the Binance blockchain BNB Smart Chain (BSC) where I avail of a trader to put my buy and sell orders. In addition, Shitcoins abound in these parts, reportedly due to the low gas price compared to other blockchains.
- they had earned a reputation of safe place (free of scams). I can confirm they have not lived up to the expectations, not at all.
I am not encouraging to trade Shitcoins, quite the opposite. Please read the article(s) before drawing any conclusion.
DATA
Let’s have a quick look in to the data:
Newly listed tokens
Data scraped from the well-known price-tracking websites and enriched with other sources.
- Coin: [String] Name of the Shitcoin.
- Code: [String] Shortname of the Shitcoin.
- Contract: [String] BSC contract id of the Shitcoin..
- API_id: [String] Shitcoin identifier to be used in the API provided by the “source”.
- Source: [String] Either CongGecko or CoinMarketCap.
- Added_timestamp: [Timestamp] When the Shitcoin was discovered and added to the file.
- Score: [Integer] Score provided by Token Sniffer - a smart contract scam scanner - at the time of discovery. Notes: -1 not found or token pending. -5 The score retrieval threw an error.
- Botty_price: [Number] Price as retrieved by the trader Botty at the time of discovery.
- IsPancakeSwapV2: [Boolean] Whether the Shitcoin is available in PancakeSwapV2. Implemented as an API call to Bitquery.io.
1NEW_TOKENS <- read_csv('data/NEW_LISTED_TOKENS.csv',)
2kable(head(NEW_TOKENS,5), caption = 'First 5 rows of newly listed tokens')| X1 | Coin | Code | Contract | API_id | Source | Added_timestamp | Score | Botty_price | IsPancakeSwapV2 |
|---|---|---|---|---|---|---|---|---|---|
| 384 | HoppyInu | HOPPYINU | 0x2e7f28f0d27ffa238fdf7517a3bbe239b8189741 | hoppyinu | CoinGecko | 2023-02-26 06:02:17 | -5 | ||
| 385 | CEO | CEO | 0x237ace23ab2c36a004aa5e4fb134fe5c1cedf06c | ceo | CoinGecko | 2023-02-26 07:02:17 | 100 | ‘0.0001359185’ | True |
| 386 | Crimson Network | CRIMSON | 0x2ee8ca014fdab5f5d0436c866937d32ef97373b0 | crimson-network | CoinGecko | 2023-02-26 07:43:16 | 75 | ‘0.0000007451’ | True |
| 387 | DogeArmy | DOGRMY | 0xbf758f2afec32b92e8008b5671088d42af616515 | dogearmy | CoinGecko | 2023-02-26 07:49:16 | 55 | ‘0.0000000000’ | True |
| 388 | SB Group | SBG | 0x5E95A952a7f79f978585aFd54A053aF0f51372Fa | sb-group | CoinMarketCap | 2023-02-26 18:38:14 | 5 |
Price history after the listing
Detailed price information is not always availble through the free APIs at those websites. Each new listed token was monitored by means of a third party solution capturing the following details approx. every 5 minutes and saved on its own CSV file “{added}-{code}-{contract}.csv”.
- unixtime:[Integer] Unix_time of the price
- usd_price: [Decimal] Price in USD
- utility_price: [Decimal] Price in the paired token.
- timestamp: [Datetime] Timestamp corresponding to the unixtime
 1to_datetime <- function(unixtime) {
 2  return(as_datetime(unixtime/1000))
 3}
 4token <- NEW_TOKENS  %>% filter(Code == 'CRIMSON')
 5
 6code <- token[['Code']]
 7contract <- token[['Contract']]
 8added <- format(date(token[['Added_timestamp']]),'%Y%m%d')
 9filename <- glue('{added}-{code}-{contract}.csv')
10log_info(glue('generating dataframe for {filename}'))
11
12csv_file <- file.path('data',filename)
13hist <- read.csv(csv_file, header=T, stringsAsFactors = F)
14
15df_raw_price <- hist %>% mutate(timestamp = to_datetime(unixtime))
16options(scipen=999)
17kable(head(df_raw_price,5), caption = 'First 5 rows of price history after the listing event')| X | unixtime | usd_price | utility_price | timestamp |
|---|---|---|---|---|
| 1 | 1677412148120 | 0.0002639 | 0.0000009 | 2023-02-26 11:49:08 |
| 2 | 1677412248720 | 0.0002639 | 0.0000009 | 2023-02-26 11:50:48 |
| 3 | 1677412548300 | 0.0002764 | 0.0000009 | 2023-02-26 11:55:48 |
| 4 | 1677412848581 | 0.0002569 | 0.0000008 | 2023-02-26 12:00:48 |
| 5 | 1677413148784 | 0.0002604 | 0.0000009 | 2023-02-26 12:05:48 |
Next, I chart the price change respect to the price when the shitcoin is listed (named as “purchase_price” in the code as the token was immediately purchased as soon as listed) over time as a boxplot to get an idea of the distribution.
 1purchase_price <- hist$utility_price[1]
 2
 3df_price <- data.frame(
 4    timestamp = hist$unixtime,
 5    price = hist$utility_price,
 6    p_var = (hist$utility_price - purchase_price) * 100 / purchase_price
 7    , stringsAsFactors = F)
 8
 9df_price <- df_price %>% mutate(timestamp = to_datetime(timestamp))
10plot1 <- plot_ly(x=df_price$timestamp, y=df_price$p_var, type='scatter', mode='lines', name=token[['Coin']])
11plot2 <- plot_ly(y=df_price$p_var, type='box',  name=glue('{token[['Code']]}'), showlegend=F)
12plot <- subplot(plot1, plot2, shareY = TRUE, nrows=1, widths = c(0.9,0.1))
13plot
Early (probably wrong) conclusions
- Reasons for optimism: ther are a few spikes after the listing event.
- The volatility and change rate is higher than anticipated.
- Shortly after the listing event, the effect wanes off.
Stay tuned, the journey has only begun.